HTML links graph visualizer
get a visual representation of links between HTML pages as a graph
(aka: automatic site map)
quick for hackers
postdata to the php scripts (it's not so comfortable done by hand..);
This has been tested and works for me on: Win2000, PG 7.2.3 under cygwin, Oracle 8.1.7, php 4.1.1, apache 1.3.12
introduction
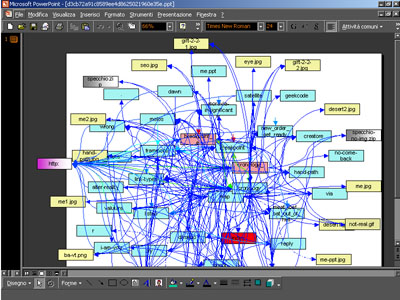
I started developing this application because I had a complex subdirectory on my site (this) and wanted to graphically see how much some pages were linked to some others.
The first idea was to track also intra-page links (anchors on the same page, like this), but it seems unfeasible if not using previously some special convention in the HTML, eg. always assigning a name to a block that is a referring element.
So at present anchors are identified but not visually shown either than as a quantified measure (by the link colour), and the only output graph is for HTML pages.
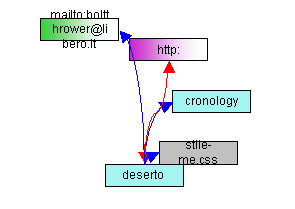
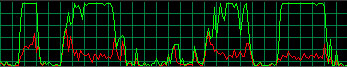
In the end you'll get something like:
In this example I've chosen to analyze only one page from a specified dir: deserto.html, the first from the bottom (named simply as "deserto");
the picture shows every link found in this file, actually 6:
| link to | colour | |
|---|---|---|
| html page | light blue | |
| http:// | fucsia with gradient | |
| .jpg | light yellow | |
| .gif and .png | darker yellow | |
| .css | light gray | |
| .zip | light gray with gradient | |
| mailto: | light green with gradient |
The number of links to a page is represented with a different color, from blue (min) to red (max), scaling the range of colours to the most representative values for each new graph.
installation
I don't explain here how to install Oracle or PostgreSQL;), neither php: just this application.
grafi.
configure.incto meet your needs: choose your db type and set up the user, password, dbname and port;
scan-dir.php
reference guide
The first page you might get looks like this:
Step 1
(don't try, it does not work here;)
The default option is to look only for .html files; so if you have the bad habit of naming .htm, or have some .old files (or else) you also want to analyze, switch off the checkbox.
Step 2
(this is just an example for my site root dir)
Specify the files you want to search for links.
Note that this are links from: eg. if you choose a single file who's linked to any other in that dir, you'll see all of them in the graph, but only the links starting from the chosen one.
The same goes for parent and child dirs options: if there are links to different folders you may see them or not.
The normalize links
options stands for
The select/unselect all
is just a convenience; checks or unchecks all the files.
Step 3
(again, an example;)
This is the final, just-informative page.
For each file, you can see, in column order:
hrefand 2 for
src)
<A>tag)
The .ppt files are saved in a
temp
folder inside the one you've put the php scripts, named with an
md5(time())
You can change the font and box size used in the .ppt changing the values in
configure.inc
(cited previously, ^).
Modifying the spiral disposition of the boxes, or its radius, bending, or the angular distance between each box and so on is more difficult, and you'll have to modify a SQL view. See next paragraphs.
architecture overview
Some of the basic ideas and concepts behind this application are taken from Ka-Ping Yee CritLink Mediator (eg. so called coarse links).
Analyzing connections between HTML pages requires a first introduction to HTML itself.
Two generical objects can be linked in different ways:
Atags
IMG, IFRAME, FRAME, AREAtags
LINKtags, that can be
rel(forward) or
rev(reverse)
BASEtag, that specifies an URI to be considered the base for all other URIs in the document. (note: at present this is erroneously managed as a normal href, so every relative link will be wrongly interpreted)
We can now identify two levels of structure in HTML documents, regarding this limited application context:
This is not true in the second case (anchor1 refers to anchor2, but anchor1 should have not an
id
or
name
attribute, since both can be just one of the tags listed above).
From this simple fact stems the problem noted in the introduction ^: generally a referring element can't be identified and so it can't be graphically positioned.
implementation details
I've created then two SQL tables for this two levels, named
gruppi
(italian for groups), and
elementi
(italian for elements).
You may think this is an accident, and that I could name them more clearly, eg.
pages
and
anchors
..
But the seemingly strong difference cited before is not so real, because an anchor can link, on the upper level, an entire document, not a definite place in it: these are so called 'coarse' links.
Each link is infact saved 2 times, one for the referred anchor and one for the page (actually one if it was yet a coarse link). Pages are then more clearly intended as groups of elements.
The first implementation I've done has been on Oracle. I'll refer to this db in the next part of this paragraph:
create table gruppi (
       cod integer,
       descr varchar2(200),
       l_succ varchar2(1600),
       g_succ varchar2(1600),
       g_ord integer,
       e_ord integer,
       primary key (cod)
);

create table elementi (
       cod integer,
       descr varchar2(200),
       cod_gruppo integer,
       l_cod_gruppo integer,
       l_strength integer,
       l_type integer,
       primary key (cod)
);
During the parsing of each selected HTML file, both this tables are populated: each page and anchor gets its code (column cod
) from a distinct sequence;
gruppi
l_succon gruppi will contain in the end a comma separated string representing the list of all linked anchors for that group;
g_succwill contain a similar string with the list of all linked pages for that group, included the ones infered from linked anchors (forced as coarse links).
g_ordwill get the position of the group when it's ordered by an estimated number of linked groups. It's used to select the better positioning for boxes on the .ppt, centering the most linked ones and distributing the others evermore far.
e_ordis not used at present, it's planned to be in the future for an experimental version that would represent also infra-page links.
elementi
cod_gruppo: the code of the page in which this anchor has been found;
l_cod_gruppo: the code of the linked page;
l_strength: the link strength, that is: how many times this same relation has been found.
l_type: the link type: 1 for
hrefand 2 for
srcattributes.
There should be also a l_succ
column to represent the list of linked anchors for this element [eg. again an anchor]; future version.
I'll skip the stored procedures and functions and will concentrate on the external representation of the data, that should be more interesting and useful.
create or replace view vw_grafo_g  as
select
       descr,
       cod,
       g_succ,
       sin(g_ord / 1.5) *  sqrt(g_ord *4 ) * 38 +200 pos_x,
       cos(g_ord / 1.5) *  sqrt(g_ord *4 ) * 22 +200 pos_y,
       g_ord
from  gruppi g
order by length(g_succ) desc;
This is the main view that writes out the final graph, in an oversimplified version (don't mind about the strange names you'll find in the real SQL script that actually creates the view: they come from an old revised project;)
pos_x
and pos_y
will be the coordinates of each box;
the angular distance between each box can be modified changing the fixed values 1.5
; the spiral shape is driven by a square root trend (the sqrt
function), while the other fixed values have been hand tested and are quite reasonable with my default powerpoint settings.
The only other view used at present is recreated dinamically for each new graph, but just for convenience; a static example version follows:
create or replace view vw_connector_color as
select
  fn_valuta  ( nvl( sum(l_strength) ,0),
               max_s,
               max_s/3,
               1 ) conta,
  count(*) count_orig,
  sum(l_strength)  strength ,
  max(l_type) l_type,
  cod_gruppo, l_cod_gruppo
from elementi
group by cod_gruppo, l_cod_gruppo
order by 1 desc;
max_s
is the parameter by which the view is recreated: it will evaluate to the absolute maximun link strength for this graph.
fn_valuta
is a function that decodes a given set of (value,target,tolerance)
to a colour, from red to blue. The chosen tolerance of max_s/3
is an empiric finding, but I suspect there is a better value, more mathematically sound. I hope for some comments on this.
porting from Oracle to PostgreSQL
There are some trivial differences between Oracle and PG, in the end it's been quite simple to port from one to the other.
A first note to keep in mind is the quickly forgettable use of special characters in PG; the Oracle function
create or replace function  fn_normal ( x varchar2 ) return varchar2 is
begin
   return lower (replace (x,'/','\') );
end;
becomes then
create or replace function  fn_normal ( varchar) returns varchar as '
begin
   return lower (translate ($1,''/'',chr(92)) );
end;' language 'plpgsql';
A more interesting difference is in the vw_connector_color create view
script:
this quite simple Oracle select
select nvl(max(sum(l_strength))/3, 0)  into max_s
 from elementi
group by cod_gruppo , l_cod_gruppo;
that calculates the first parameter then passed to the
fn_valuta, with PG gives an "
Aggregate function calls may not be nested" error. Anyway you've simply to use a subselect:
select nvl(max( sum_1)/3.0::numeric,0.0::numeric)  into max_s
 from (select sum(l_strength) as sum_1 from elementi
       group by cod_gruppo , l_cod_gruppo) x;
A last and deeper difference is in transactions management: as of 7.2.3 PG version, it's clearly specified in the manual that
First of all, begin transaction
and commit
are not even plpgsql valid syntactical expressions, since they can never be used in a function. They are strictly SQL statements, and as such can be used only outside a function.
Another PG charachteristical difference vs. Oracle is its default autocommit: each DML, if not differently stated by a begin transaction
, is automatically committed.
The combination of this two issues, plus a very poor performance result I had in the beginning with PG made me think it was a transactional problem:
begin transaction, performaces were quite 10 times worst then Oracle. I then thought (erroneously) that the functions were still committing each time I called them, and you may know this wouldn't be so great..
optimization and performances
Though this is not intended to be a multiuser or multitasking, intensively requested application, I tried to set it up to run in a reasonable time.
There are mainly 2 steps that use a lot of resources:
gruppiand
elementi, or better, the relation between them
The first working Oracle version of this step has been running on my PC (AMD K6 800Mhz, 256Mb, HD IDE 20Gb) in ~20 sec., with the following Oracle configuration (from the init.ora
):
db_block_buffers = 6084
shared_pool_size = 16613785
db_block_size = 8192
parallel_max_servers = 5
and no other active running session apart from mine.
A first PostgreSQL version, doing exactly the same thing with no optimization and without even a transaction management, worked out in ~60 sec.; a more accurate statistical test has given a factor of 4 (16 sec. for Oracle and 62 for PG).
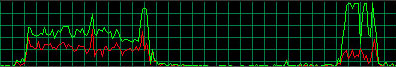
As I said before, adding a begin transaction
worsened the performances up to 100-110 sec.
This made me clearly understand that it was a memory leackage problem: I was starting the postmaster
with all default settings, and I noted that this way PostgreSQL SHARED_BUFFERS
configuration parameter was setting to just 64!
Changing this parameter to 256 brought the elapsed time down to ~38 sec., at 512 or more (up to 4096) I had a best result of 30 sec., but never less. Taking away the transaction at 4096 the step was taking again ~60 sec., and also read/written bytes for the process as told by windows' task manager had increased (more than double).
But I thought it was still taking too much time, too worse than Oracle, and was asking myself why.
So I've tried to reorganize and change the schema of this step, substituting the direct analysis on-the-fly of any link that I was doing, with a simple first step batch insert: I've created a parking table where links are temporary saved:
create table trans_package (
  f varchar(200),  --gruppi.descr%type
  g varchar(200),  --gruppi.descr%type
  h varchar(200),  --elementi.descr%type
  t integer
  );
Then a cursor on this table calls the first original procedure that was analyzing and grouping the links.
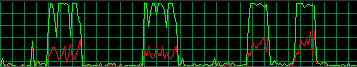
With this new course I've got a ~20% improvement, till an elapsed time of 24 sec. (with transactions and 4096 shared buffers).
A last drastic improvement has been to change all delete
statements with truncate
; after doing also a vacuum full
of all tables the time has dropped to 7-10 sec.
In this final situation, PostgreSQL was doing the same job as Oracle, in half time, using less than half memory (21Mb instead of 46 Mb).
licensing
There's no copyright on the source codes, nor this documentation.
The licensing policies that applies are GPL and FDL respectively.
I only ask, in case of commercial use, to receive by email the site URL of the company (there is no enforcement on this).